One screen for the whole delivery day
Northgate Logistics · Regional logistics
A growing delivery firm was running on spreadsheets, phone calls and five tools that didn't talk to each other. We connected them, automated the routine steps, and gave the operations team one screen to run the day from.
- Service
- Tech solutions
- Timeline
- 10 weeks
- Deliverables
- Tech and tooling audit
- System integrations
- Order-to-invoice automation
- Operations dashboard
- Staff training and support
The brief
Northgate deliver for retailers across the region. As they grew, the office started to creak: orders arrived by email and web shop, drivers were assigned by phone, customers called to ask where their parcel was, and invoices were typed up at the end of the month.
They didn’t need a new system. They needed the ones they had to work together.
What we did
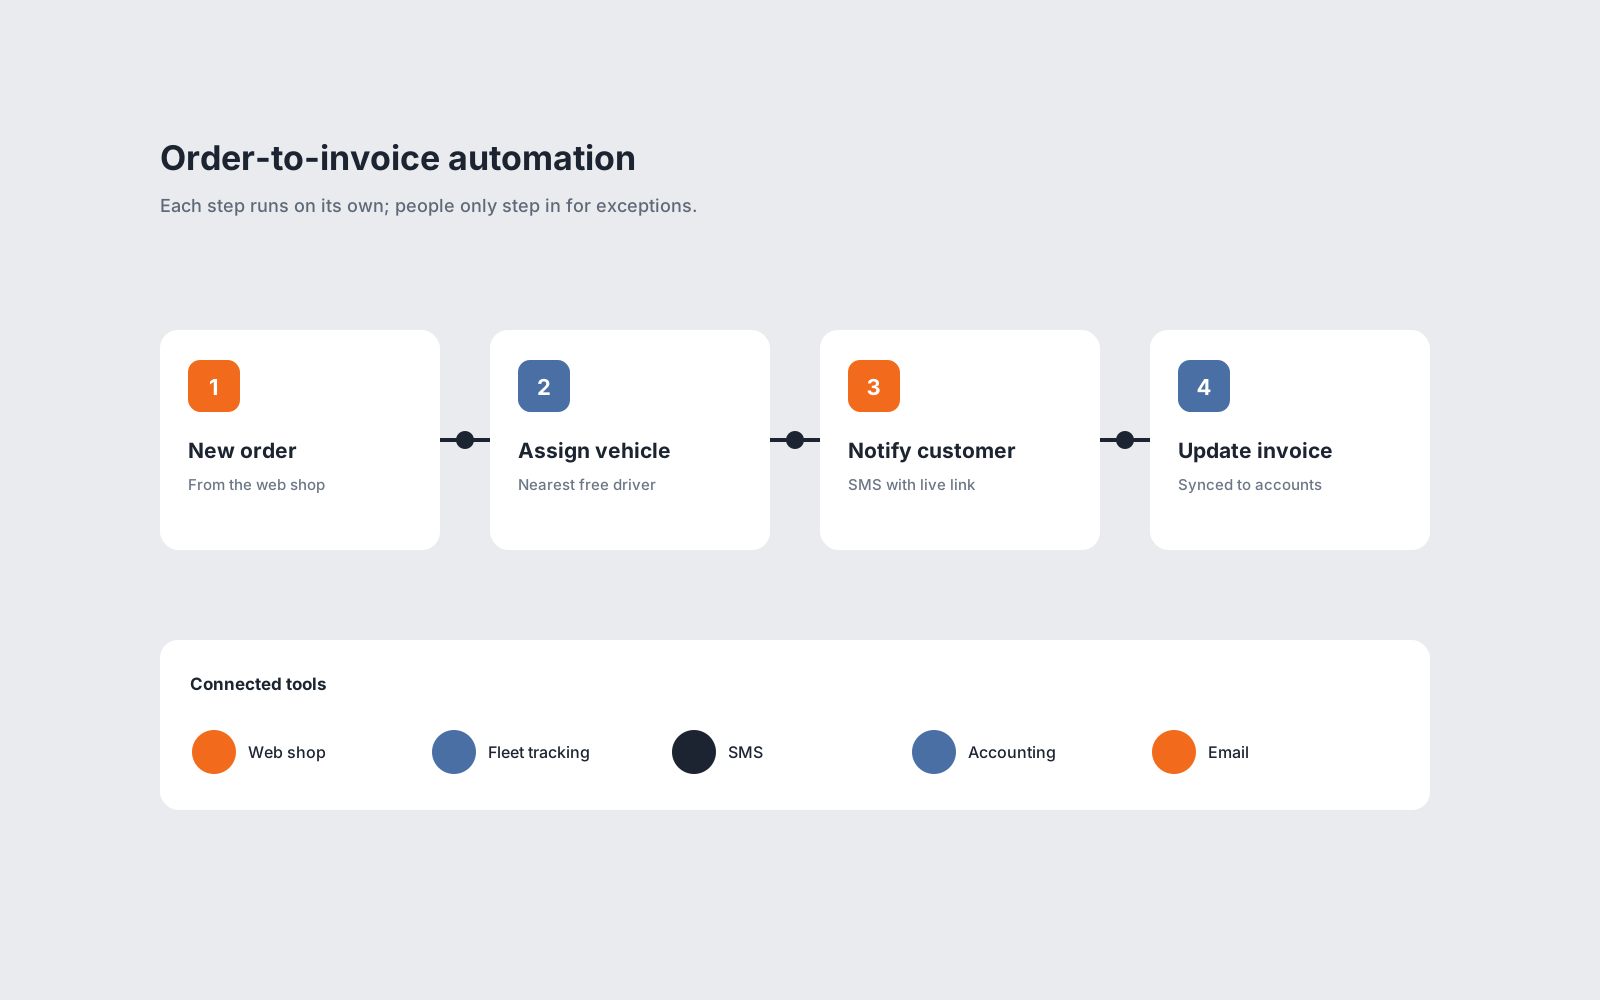
We spent the first two weeks watching the day happen and listing every place information was copied by hand. Then we connected the web shop, fleet tracking, SMS and accounting tools so an order flows through on its own: it is assigned to the nearest free driver, the customer gets a live tracking link, and the invoice updates when the delivery is signed for.
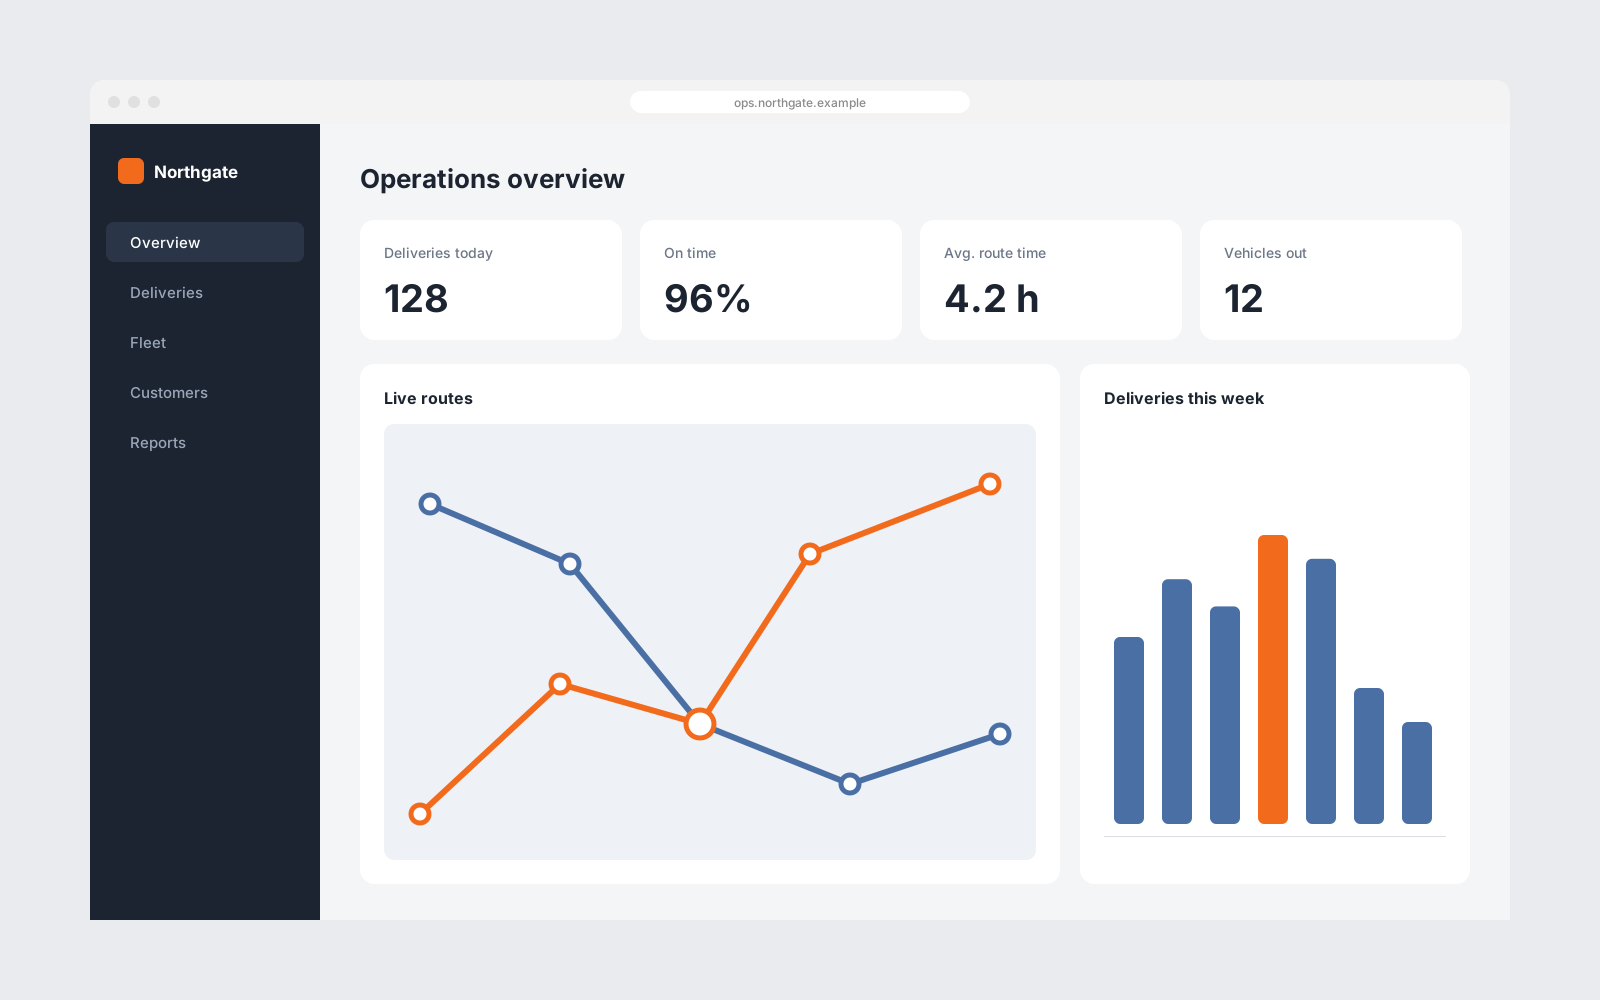
The operations team got one dashboard showing the day’s deliveries, the vehicles out and anything that needs attention, and we trained the office team to adjust it themselves.
The result
The phones are quieter, month-end invoicing takes an afternoon instead of three days, and the operations team spends its time on the exceptions instead of the routine.
Month-end used to take three days of re-typing. Now it's an afternoon, and the phones are quiet enough to think.
Outcomes
- of admin saved each week
- 11 h
- invoices re-typed by hand
- 0
- dashboard instead of five tools
- 1
Illustrative figures for a sample project.
| Period | Value |
|---|---|
| Wk 1 | 22 |
| Wk 2 | 21 |
| Wk 3 | 23 |
| Wk 4 | 14 |
| Wk 5 | 12 |
| Wk 6 | 11 |